2018 National Center for Education Statistics STATS-DC Conference
Date: July 27, 2018

At this year’s NCES DC Stats Conference, “Visualizing the Future of Education Through Data,” Optimal Solutions shared its work on the National Assessment of Educational Progress (NAEP) and with state assessment data via a presentation and demonstration booth.
To an audience of policy makers, researchers, and more, Dr. Brian Cramer of Optimal and Ebony Walton and Dr. Grady Wilburn of NCES presented on the latest innovations in analyses and visualizations used to report and disseminate NAEP student performance data to the public.
In recent years, for example, the Nations Report Cards have added interactive maps, videos, indices from survey questionnaire data, and bubble charts to let users explore relationships between contextual data and NAEP student performance.
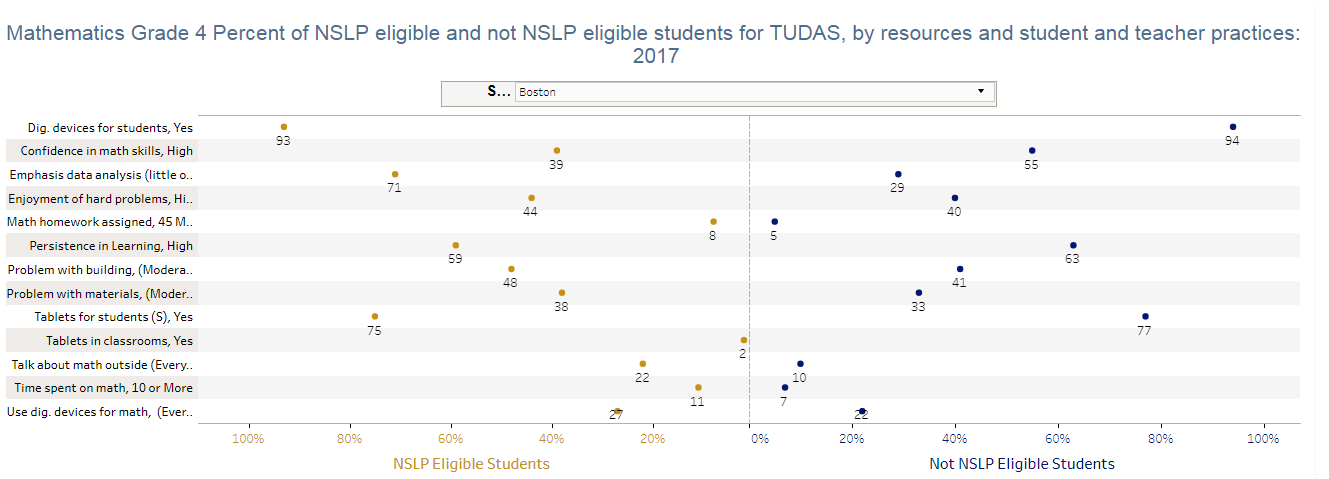
This presentation highlighted analyses and visualizations from the 2017 mathematics and reading results that build upon previous enhancements, focusing on student attitudes, school spending, teacher practices, student and school educational resources, and equity measures at the state and district levels.
The presentation took a deeper dive into the relationships between NAEP contextual variables and student performance, featuring data visualization techniques that allow for a more nuanced understanding of the information.
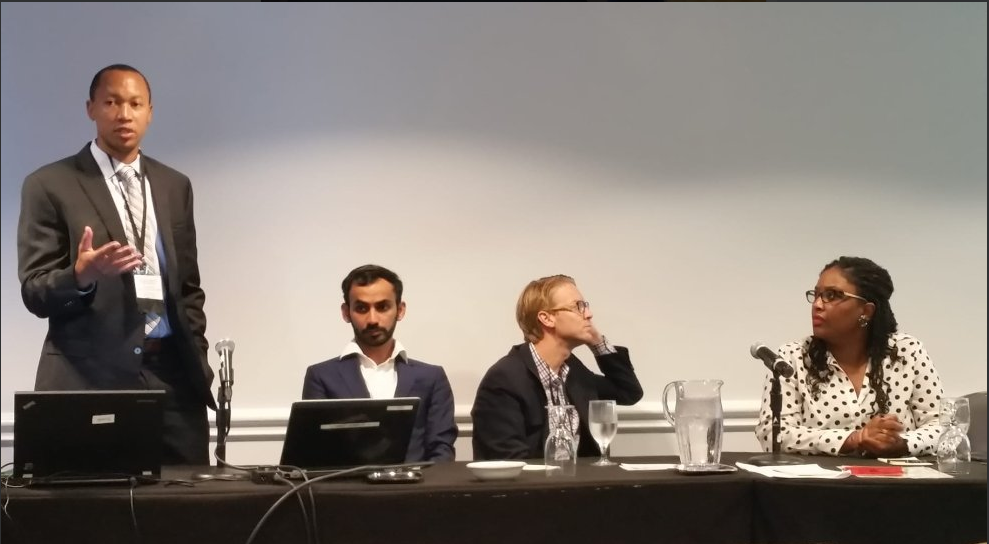
Dr. Grady Wilburn of NCES speaks during the Optimal Solutions presentation on new analyses and visualizations that help put students’ mathematics and reading data in context, leading to a more comprehensive understanding of the information. Seated are Keval Bhanushali and Dr. Brian Cramer of Optimal Solutions, and Ebony Walton of NCES.At its demonstration booth, Optimal Solutions showcased a new tool in development that will house both state assessment and education policy data along with NAEP performance data.
In recent years, the analysis and reporting of survey questionnaire data have increased, as indicated by the Student Experiences section on the Nation’s Report Cards, NCES’s soon to be released NAEP Survey Questionnaire reports, and the products circulated by NAEP stakeholders focusing on contextual data. This survey questionnaire data helps contextualize students’ performance on NAEP and can provide actionable data to policymakers, school leaders, and teachers for improving educational outcomes.
In addition to NAEP survey questionnaire data, analysis of key state education policies and NAEP student performance can be useful for contextualizing the NAEP results — especially at the state level. For example, looking at the relationships between the type of end-of-year state assessments used by states, the mode used for administering these assessments, and/or states’ standards/curricula provides insights into state trends and comparisons across states.
To make these comparisons easy and allow users to discover interesting stories, different sources of data need to be linked and harmonized, and data need to be presented in a format that allows for customizable, interactive, and engaging reports. This demonstration highlighted some of the data in the tool, the kinds of analyses that can be performed, and the types of visualizations that can be created to make important comparisons and identify interesting relationships between NAEP performance and state education policies.
Download presentation slides (PowerPoint)
The Optimal Solutions demonstration booth highlighted a new tool that will house and help draw relationships between key data.