Women’s Business Center Client Growth Dynamics
This interactive dashboard was created using client survey data from the U.S. Small Business Administration’s Women’s Business Center (WBC) program.
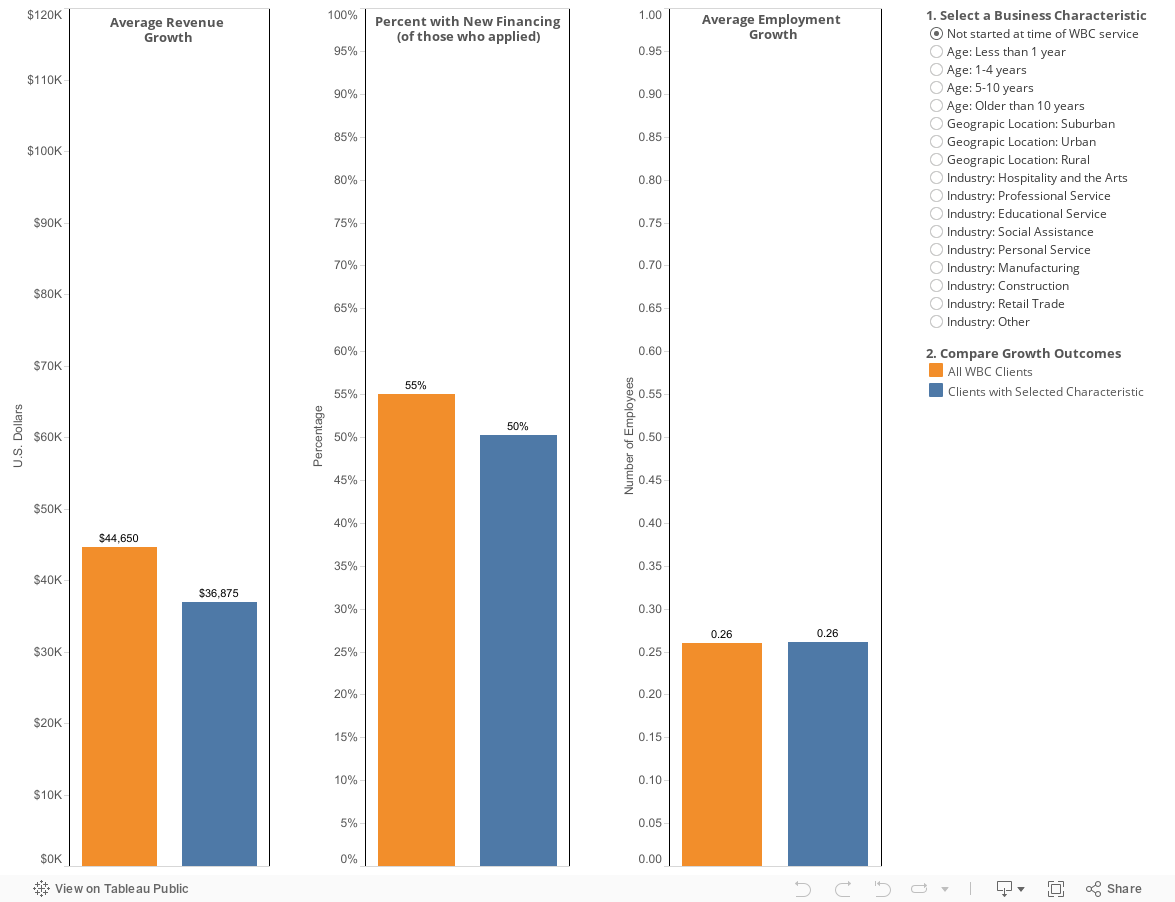
Select a business characteristic on the right-side filter pane to explore the annual change in the average business client to a WBC, by industry, age group, or geographic region. The orange bar represents the average change in the 2014 and 2015 WBC client population. The blue bar represents the change in businesses given the characteristic you selected. For example, click the circle next to “Age: less than 1 year” to see the annual revenue growth, employment growth, and percentage of businesses that received financing for businesses that have been in operation for less than 1 year at the time they visited a WBC.
Be aware that there are many factors that affect business growth that are neither shown in this dashboard nor collected from clients by the SBA. Additionally, the survey methodology does not permit attribution of change to the assistance provided by the WBCs.
Any reference on this webpage to a specific product, process, or service does not constitute or imply an endorsement by SBA or the United States Government of the product, process, or service, or its producer or provider. The business conditions, views, and opinions expressed on the webpage do not necessarily state or reflect those of the SBA or the United States Government.